If your app is slow on some devices or Android Studio’s Instant Run features stop working randomly, then you might be experiencing memory leaks.
One of the great things about Java is the garbage collector (GC). A garbage collector runs periodically to check objects that are not in use and removes them. A memory leak will happen when there are objects that there are not in use by the app but the garbage collector cannot recognize them. Hence, they will remain in memory unused, reducing the amount of memory available for the app, which causes unexpected results.
There are several ways to do so. We are going to cover some of them in this article.
But first, let’s write some code that could produce a memory leak. We will create an app with two activities. Activity A will have a button that opens Activity B. Alongside this, we will also create a singleton class that holds a static reference of a Context.
We are going to call this singleton from Activity A
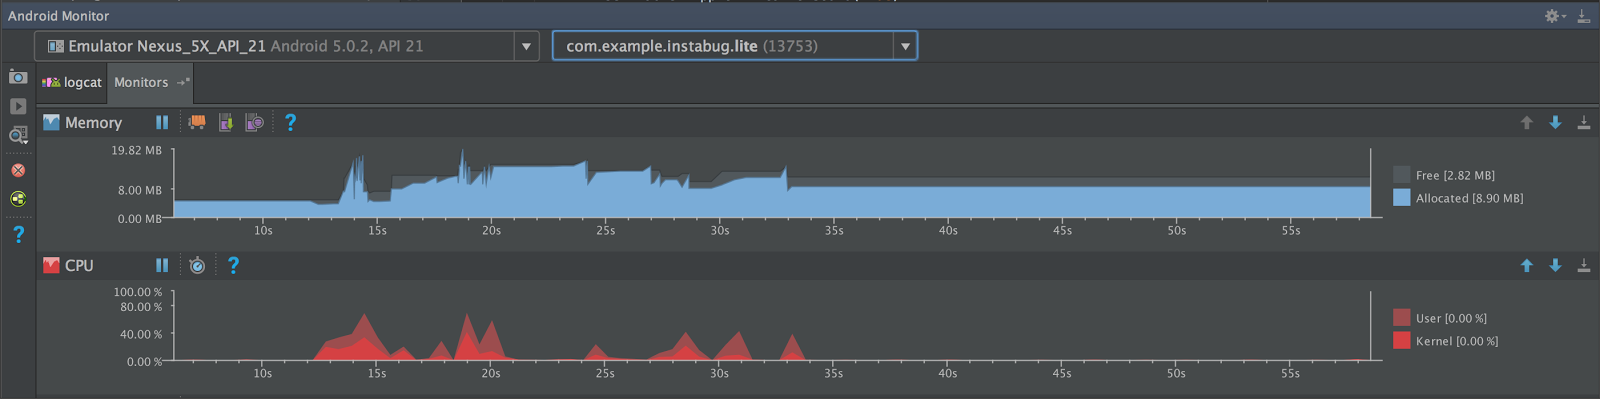
Android Studio provides handy tools for profiling the performance of your app, and one of them is the Memory Monitor. We can use the Memory Monitor to detect memory leaks through the following steps:
- Run your app on your mobile device or an emulator.
- Open Android Monitor (Press Cmd + 6 in Mac or Alt + 6 in Windows). At the top of Memory Monitor, click on Start Allocation Tracking.
- Use the app around the part that you suspect may be experiencing a memory leak. In our example, we will go to another activity.
- Click on Initiate GC to force the garbage collector to start collecting objects that are not currently in use and remove them. You should see the memory graph decline a little bit.
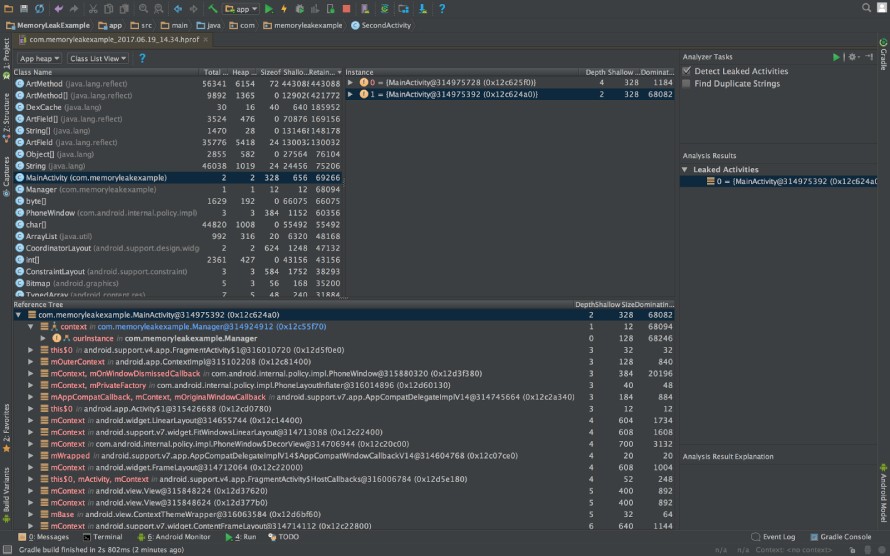
- Click on Dump Java Heap to let Android Studio generate a .hprof file that contains a heap snapshot. The easiest way to check a memory leak is by using Analyzer Tasks
- Open the Analyzer Tasks tab and then click on Run at the top of this tab. You should see the leaked activities in the Analysis Results tab below the Analyzer Tasks tab.
Leak Canary is a library made by Square and it's a very fast way to detect memory leaks. Leak Canary allows you to detect memory leaks in longer runs because you don’t need to connect your device to the Android Studio and monitor your app for a long period of time. Leak Canary will send you notifications whenever there is a memory leak.
Integration of Leak Canary is really easy. All you need to do is to add the following to your app level build.gradle file:
Then add the following code to your Application class:
And that’s it, you’re good to go.
Infer is a static analyzer tool made by Facebook that helps you find possible null pointer exceptions and resource leaks as well as annotation reachability, missing lock guards, and concurrency race conditions. It’s a good tool to add to your CI to overcome all possible bugs. It's also open source, so development of the tool is still evolving. You can find more info about Infer in their Quick Start documentation.
References:
Learn more:
- How to Fix the Top 5 Android Crashes
- Key Performance Optimization Strategies for Your Android App
- Why Does Your App Keep Crashing?
- Mobile App Quality: An Essential Guide
Instabug empowers mobile teams to maintain industry-leading apps with mobile-focused, user-centric stability and performance monitoring.
Visit our sandbox or book a demo to see how Instabug can help your app